- ডেটাসেটের প্রাপ্যতা
- 2015-06-27T00:00:00Z–2026-06-17T08:56:31.942000Z
- ডেটাসেট প্রযোজক
- ওয়ার্ল্ড রিসোর্সেস ইনস্টিটিউট গুগল
- ট্যাগ
বর্ণনা
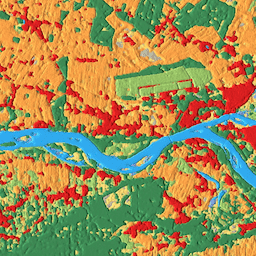
Dynamic World is a 10m near-real-time (NRT) Land Use/Land Cover (LULC) dataset that includes class probabilities and label information for nine classes.
২০১৫-০৬-২৭ থেকে বর্তমান পর্যন্ত সেন্টিনেল-২ এল১সি সংগ্রহের জন্য ডাইনামিক ওয়ার্ল্ড প্রেডিকশন পাওয়া যায়। অক্ষাংশের উপর নির্ভর করে সেন্টিনেল-২-এর পুনরাগমন হার ২ থেকে ৫ দিনের মধ্যে থাকে। যে সকল সেন্টিনেল-২ এল১সি ছবিতে মেঘের পিক্সেল শতাংশ (CLOUDY_PIXEL_PERCENTAGE) ৩৫% বা তার কম, সেগুলোর জন্য ডাইনামিক ওয়ার্ল্ড প্রেডিকশন তৈরি করা হয়। এস২ ক্লাউড প্রোবাবিলিটি (S2 Cloud Probability), ক্লাউড ডিসপ্লেসমেন্ট ইনডেক্স (Cloud Displacement Index), এবং ডিরেকশনাল ডিসটেন্স ট্রান্সফর্ম (Directional Distance Transform)-এর সমন্বয়ে মেঘ এবং মেঘের ছায়া অপসারণের জন্য প্রেডিকশনগুলোকে মাস্ক করা হয়।
ডাইনামিক ওয়ার্ল্ড সংগ্রহের ছবিগুলোর নাম, সেগুলো যে স্বতন্ত্র সেন্টিনেল-২ এল১সি অ্যাসেটগুলো থেকে উদ্ভূত হয়েছে, সেগুলোর নামের সাথে মিলে যায়, যেমন:
ee.Image('COPERNICUS/S2/20160711T084022_20160711T084751_T35PKT')
has a matching Dynamic World image named: ee.Image('GOOGLE/DYNAMICWORLD/V1/20160711T084022_20160711T084751_T35PKT').
All probability bands except the "label" band collectively sum to 1.
ডাইনামিক ওয়ার্ল্ড ডেটাসেট সম্পর্কে আরও জানতে এবং কম্পোজিট তৈরি, আঞ্চলিক পরিসংখ্যান গণনা ও টাইম সিরিজ নিয়ে কাজ করার উদাহরণ দেখতে, "ইন্ট্রোডাকশন টু ডাইনামিক ওয়ার্ল্ড" টিউটোরিয়াল সিরিজটি দেখুন।
যেহেতু ডাইনামিক ওয়ার্ল্ড ক্লাস এস্টিমেশনগুলো একটি ছোট মুভিং উইন্ডো থেকে প্রাপ্ত স্থানিক প্রেক্ষাপট ব্যবহার করে একক চিত্র থেকে উদ্ভূত হয়, তাই সুস্পষ্ট স্বতন্ত্র বৈশিষ্ট্যের অনুপস্থিতিতে, শস্যের মতো পূর্বাভাসিত ভূমি আচ্ছাদনগুলোর জন্য শীর্ষ-১ "সম্ভাবনা" তুলনামূলকভাবে কম হতে পারে, যেগুলো সময়ের সাথে সাথে আচ্ছাদন দ্বারা আংশিকভাবে সংজ্ঞায়িত হয়। শুষ্ক জলবায়ুর উচ্চ-ফলনশীল পৃষ্ঠতল, যেমন বালি, সূর্যালোকের প্রতিফলন ইত্যাদিতেও এই ঘটনাটি দেখা যেতে পারে।
To select only pixels that confidently belong to a Dynamic World class, it is recommended to mask Dynamic World outputs by thresholding the estimated "probability" of the top-1 prediction.
ব্যান্ড
ব্যান্ড
পিক্সেল সাইজ: ১০ মিটার (সকল ব্যান্ড)
| নাম | মিনিট | ম্যাক্স | পিক্সেল আকার | বর্ণনা |
|---|---|---|---|---|
water | ০ | ১ | ১০ মিটার | Estimated probability of complete coverage by water |
trees | ০ | ১ | ১০ মিটার | Estimated probability of complete coverage by trees |
grass | ০ | ১ | ১০ মিটার | Estimated probability of complete coverage by grass |
flooded_vegetation | ০ | ১ | ১০ মিটার | Estimated probability of complete coverage by flooded vegetation |
crops | ০ | ১ | ১০ মিটার | ফসল দ্বারা সম্পূর্ণ আচ্ছাদিত হওয়ার আনুমানিক সম্ভাবনা |
shrub_and_scrub | ০ | ১ | ১০ মিটার | Estimated probability of complete coverage by shrub and scrub |
built | ০ | ১ | ১০ মিটার | Estimated probability of complete coverage by built |
bare | ০ | ১ | ১০ মিটার | Estimated probability of complete coverage by bare |
snow_and_ice | ০ | ১ | ১০ মিটার | Estimated probability of complete coverage by snow and ice |
label | ০ | ৮ | ১০ মিটার | Index of the band with the highest estimated probability |
লেবেল শ্রেণী সারণী
| মূল্য | রঙ | বর্ণনা |
|---|---|---|
| ০ | #419bdf | জল |
| ১ | #৩৯৭ডি৪৯ | গাছ |
| ২ | #88b053 | ঘাস |
| ৩ | #7a87c6 | প্লাবিত_উদ্ভিদ |
| ৪ | #e49635 | ফসল |
| ৫ | #dfc35a | গুল্ম এবং ঝোপঝাড় |
| ৬ | #c4281b | নির্মিত |
| ৭ | #a59b8f | খালি |
| ৮ | #b39fe1 | বরফ এবং তুষার |
ছবির বৈশিষ্ট্য
ছবির বৈশিষ্ট্য
| নাম | প্রকার | বর্ণনা |
|---|---|---|
| ডাইনামিকওয়ার্ল্ড_অ্যালগরিদম_ভার্সন | স্ট্রিং | সংস্করণ স্ট্রিংটি ছবিটি তৈরি করতে ব্যবহৃত ডাইনামিক ওয়ার্ল্ড মডেল এবং ইনফারেন্স প্রক্রিয়াকে অনন্যভাবে শনাক্ত করে। |
| qa_algorithm_version | স্ট্রিং | The version string uniquely identifying the cloud masking process used to produce the image. |
ব্যবহারের শর্তাবলী
ব্যবহারের শর্তাবলী
This dataset is licensed under CC-BY 4.0 and requires the following attribution: "This dataset is produced for the Dynamic World Project by Google in partnership with National Geographic Society and the World Resources Institute."
Contains modified Copernicus Sentinel data [2015-present]. See the Sentinel Data Legal Notice .
উদ্ধৃতি
Brown, CF, Brumby, SP, Guzder-Williams, B. et al. Dynamic World, Near real-time global 10 m land use land cover mapping. Sci Data 9, 251 (2022). doi:10.1038/s41597-022-01307-4
DOI
আর্থ ইঞ্জিন দিয়ে অন্বেষণ করুন
কোড এডিটর (জাভাস্ক্রিপ্ট)
// Construct a collection of corresponding Dynamic World and Sentinel-2 for
// inspection. Filter by region and date.
var START = ee.Date('2021-04-02');
var END = START.advance(1, 'day');

var colFilter = ee.Filter.and(
    ee.Filter.bounds(ee.Geometry.Point(20.6729, 52.4305)),
    ee.Filter.date(START, END));

var dwCol = ee.ImageCollection('GOOGLE/DYNAMICWORLD/V1').filter(colFilter);
var s2Col = ee.ImageCollection('COPERNICUS/S2_HARMONIZED');

// Link DW and S2 source images.
var linkedCol = dwCol.linkCollection(s2Col, s2Col.first().bandNames());

// Get example DW image with linked S2 image.
var linkedImg = ee.Image(linkedCol.first());

// Create a visualization that blends DW class label with probability.
// Define list pairs of DW LULC label and color.
var CLASS_NAMES = [
    'water', 'trees', 'grass', 'flooded_vegetation', 'crops',
    'shrub_and_scrub', 'built', 'bare', 'snow_and_ice'];

var VIS_PALETTE = [
    '419bdf', '397d49', '88b053', '7a87c6', 'e49635', 'dfc35a', 'c4281b',
    'a59b8f', 'b39fe1'];

// Create an RGB image of the label (most likely class) on [0, 1].
var dwRgb = linkedImg
    .select('label')
    .visualize({min: 0, max: 8, palette: VIS_PALETTE})
    .divide(255);

// Get the most likely class probability.
var top1Prob = linkedImg.select(CLASS_NAMES).reduce(ee.Reducer.max());

// Create a hillshade of the most likely class probability on [0, 1];
var top1ProbHillshade =
    ee.Terrain.hillshade(top1Prob.multiply(100))
    .divide(255);

// Combine the RGB image with the hillshade.
var dwRgbHillshade = dwRgb.multiply(top1ProbHillshade);

// Display the Dynamic World visualization with the source Sentinel-2 image.
Map.setCenter(20.6729, 52.4305, 12);
Map.addLayer(
    linkedImg, {min: 0, max: 3000, bands: ['B4', 'B3', 'B2']}, 'Sentinel-2 L1C');
Map.addLayer(
    dwRgbHillshade, {min: 0, max: 0.65}, 'Dynamic World V1 - label hillshade');
import ee
import geemap.core as geemap
কোলাব (পাইথন)
# Construct a collection of corresponding Dynamic World and Sentinel-2 for
# inspection. Filter by region and date.
START = ee.Date('2021-04-02')
END = START.advance(1, 'day')

col_filter = ee.Filter.And(
    ee.Filter.bounds(ee.Geometry.Point(20.6729, 52.4305)),
    ee.Filter.date(START, END),
)

dw_col = ee.ImageCollection('GOOGLE/DYNAMICWORLD/V1').filter(col_filter)
s2_col = ee.ImageCollection('COPERNICUS/S2_HARMONIZED');

# Link DW and S2 source images.
linked_col = dw_col.linkCollection(s2_col, s2_col.first().bandNames());

# Get example DW image with linked S2 image.
linked_image = ee.Image(linked_col.first())

# Create a visualization that blends DW class label with probability.
# Define list pairs of DW LULC label and color.
CLASS_NAMES = [
    'water',
    'trees',
    'grass',
    'flooded_vegetation',
    'crops',
    'shrub_and_scrub',
    'built',
    'bare',
    'snow_and_ice',
]

VIS_PALETTE = [
    '419bdf',
    '397d49',
    '88b053',
    '7a87c6',
    'e49635',
    'dfc35a',
    'c4281b',
    'a59b8f',
    'b39fe1',
]

# Create an RGB image of the label (most likely class) on [0, 1].
dw_rgb = (
    linked_image.select('label')
    .visualize(min=0, max=8, palette=VIS_PALETTE)
    .divide(255)
)

# Get the most likely class probability.
top1_prob = linked_image.select(CLASS_NAMES).reduce(ee.Reducer.max())

# Create a hillshade of the most likely class probability on [0, 1]
top1_prob_hillshade = ee.Terrain.hillshade(top1_prob.multiply(100)).divide(255)

# Combine the RGB image with the hillshade.
dw_rgb_hillshade = dw_rgb.multiply(top1_prob_hillshade)

# Display the Dynamic World visualization with the source Sentinel-2 image.
m = geemap.Map()
m.set_center(20.6729, 52.4305, 12)
m.add_layer(
    linked_image,
    {'min': 0, 'max': 3000, 'bands': ['B4', 'B3', 'B2']},
    'Sentinel-2 L1C',
)
m.add_layer(
    dw_rgb_hillshade,
    {'min': 0, 'max': 0.65},
    'Dynamic World V1 - label hillshade',
)
m