লগ ইনসাইন আপ করুন
Matplotlib
14.3K posts
user avatar
Matplotlib
@matplotlib
Python library for creating static, animated, & interactive visualizations. Chat w/ us @ discourse.matplotlib.org Sponsored by @NumFocus
matplotlib.org
March 2017-এ যোগদান করেছেন
112
অনুসরণ করছেন
43.9K
অনুসরণকারীগণ
  • পিন করা হয়েছে
    user avatar
    Matplotlib
    @matplotlib
    ৩০ জানু, ২০২৫
    Hey folks, if you're following other projects on other sites, you can also find us at: * instagram.com/matplotart/ * bsky.app/profile/matplo… * fosstodon.org/@matplotlib
    6K
  • user avatar
    Matplotlib
    @matplotlib
    ১৩ এপ্রি, ২০২১
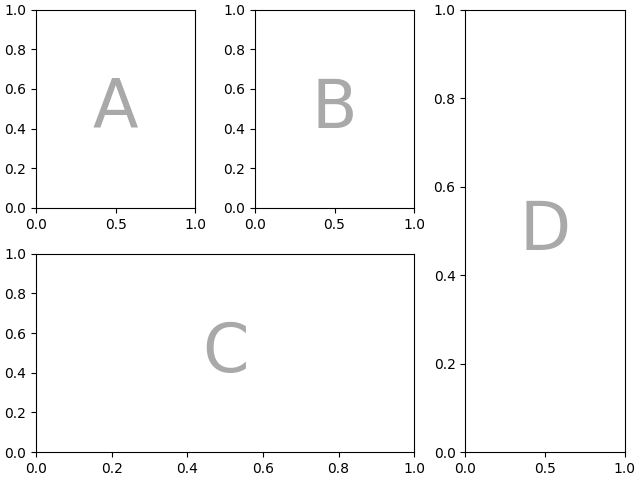
    We have this awesome function called sublots_mosaic where you can pass us a layout id'ed on name axd = plt.subplot_mosaic( """ ABD CCD """) matplotlib.org/stable/tutoria…
    user avatar
    Kaspar Märtens 💙💛
    @kasparmartens
    ১৩ এপ্রি, ২০২১
    Is it just me who needs to look up how to use matplotlib subplots *every time* I want to create a multi-panel figure in python?  I wish it was as intuitive and easy as it is in #rstats with the amazing {patchwork}. Any chance there exists something similar for #python?
  • user avatar
    Matplotlib
    @matplotlib
    ১১ এপ্রি, ২০১৯
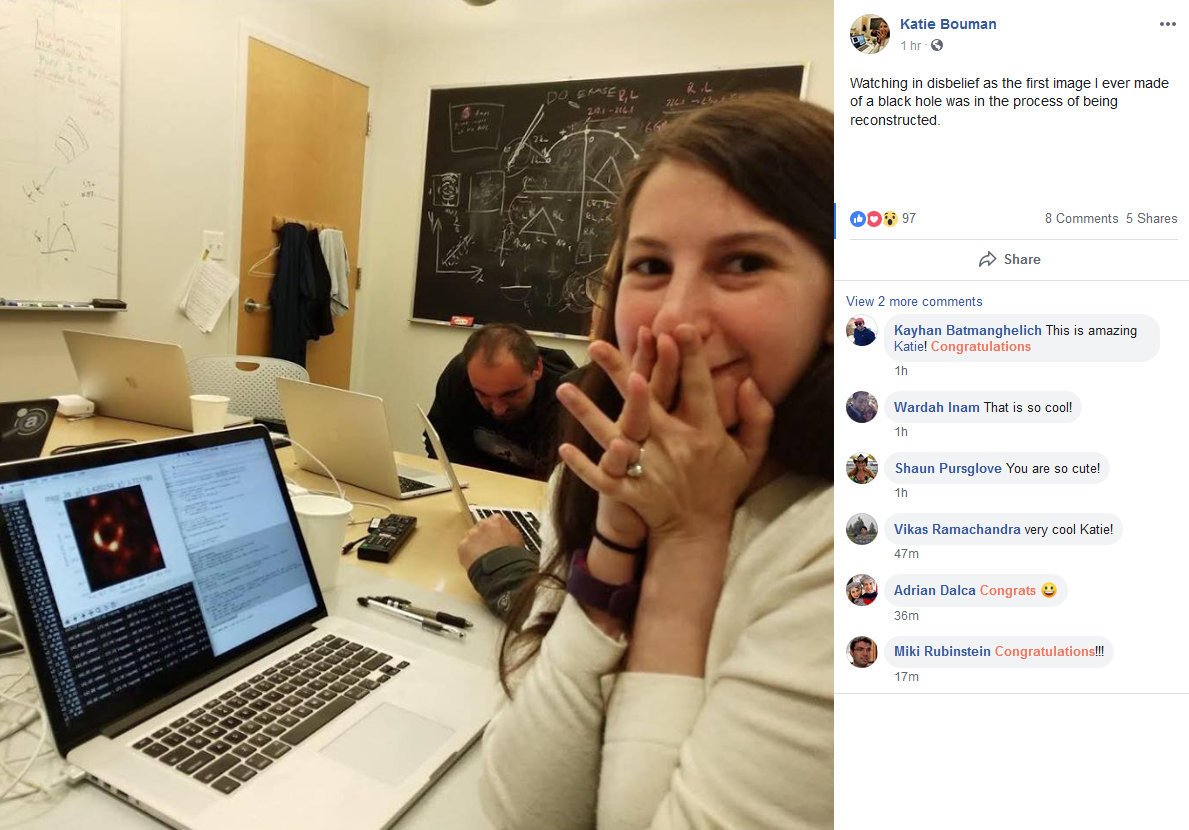
    Congrats! As many people have noted, the image was processed with the help of matplotlib and many other Python libraries helpfully cited in the paper (iopscience.iop.org/article/10.384…)
    user avatar
    MIT CSAIL
    @MIT_CSAIL
    ১০ এপ্রি, ২০১৯
    Here's the moment when the first black hole image was processed, from the eyes of researcher Katie Bouman. #EHTBlackHole #BlackHoleDay #BlackHole (v/@dfbarajas)
    iopscience.iop.org
    First M87 Event Horizon Telescope Results. III. Data Processing and Calibration
    First M87 Event Horizon Telescope Results. III. Data Processing and Calibration, The Event Horizon Telescope Collaboration, Akiyama, Kazunori, Alberdi, Antxon, Alef, Walter, Asada, Keiichi, Azulay,...
  • user avatar
    Matplotlib
    @matplotlib
    ১৯ নভে, ২০২৩
    🤯 it gorgeous
    user avatar
    Aman Chokshi
    @aman_chokshi
    ১৮ নভে, ২০২৩
    Finally had an excuse to play with @matplotlib's animation feature!
    GIF
    96K
  • user avatar
    Matplotlib
    @matplotlib
    ৮ এপ্রি, ২০২৫
    GIF
    user avatar
    Towards Data Science
    @TDataScience
    ৭ এপ্রি, ২০২৫
    Florian Trautweiler shows you how you can combine the power of OpenCV and @matplotlib to create animated real-time visualizations of such signals. towardsdatascience.com/animated-plott…
    50K
  • user avatar
    Matplotlib
    @matplotlib
    ১৯ সেপ, ২০১৮
    Happy to announce that Matplotlib 3.0 is up on pypi and ready for use! Matplotlib is Python 3 only The v2.2.x LTS branch supports py27 and will get critical bug fixes to 2020 For whats new see matplotlib.org/users/whats_ne…
  • user avatar
    Matplotlib
    @matplotlib
    ১৫ সেপ, ২০২১
    We are incredibly excited to announce that we've been awarded a @NASA ROSES grant for open source tools, frameworks, and libraries to build on the CZI work, with a focus on improving unit support. This grant allows us to hire a second RSE, job posting should be up soonish! 🥳
  • user avatar
    Matplotlib
    @matplotlib
    ১৪ সেপ, ২০২২
    like a colormap, but need the flip? append `_r` 🎨 #mpltips
    screen shot of jupyter notebook, 
first cell is `plt.get_cmap('viridis') and underneath is printed a colormap that goes purple blue green yellow
second cell is `plt.get_cmap('viridis_r') and underneath is printed a colormap that goes yellow green blue purple
  • user avatar
    Matplotlib
    @matplotlib
    ১ মে, ২০২০
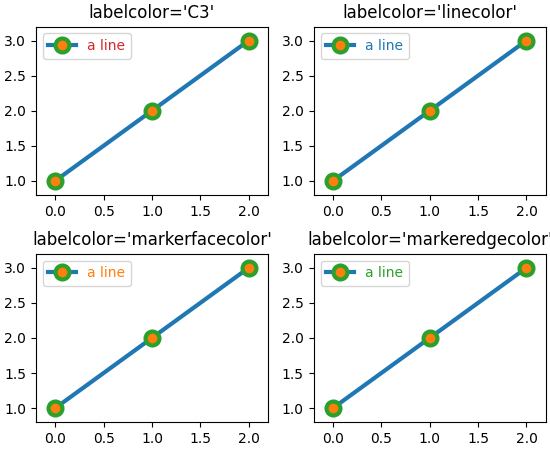
    kinda annoyed at boilerplate like ax.set_title(), ax.set_xticklabels, ax.set_ylabel, etc.? You can do it all in one function! ax.set(title=, xticklabels=, ylabel=, **kwargs) Check out examples at matplotlib.org/api/_as_gen/ma…
  • user avatar
    Matplotlib
    @matplotlib
    ১১ ফেব, ২০২০
    OMG we're album art!
    আপনি এই পোস্টটি দেখতে পারবেন না কারণ এই অ্যাকাউন্টের অধিকারী ব্যক্তি তার পোস্টগুলো কারা দেখতে পারবেন তা সীমিত করেছেন। আরও জানুন
  • user avatar
    Matplotlib
    @matplotlib
    ১৭ জুল, ২০২০
    It's out, it's out! We've been hyping our 3.3 release and it's now officially out! Semantic axes + easier axes layout, post creation sharing, turbo colormap, simplified advanced tick formatting, infinite straight lines & a whole lot more! Check it out matplotlib.org/3.3.0/users/wh…
  • user avatar
    Matplotlib
    @matplotlib
    ১১ আগ, ২০১৯
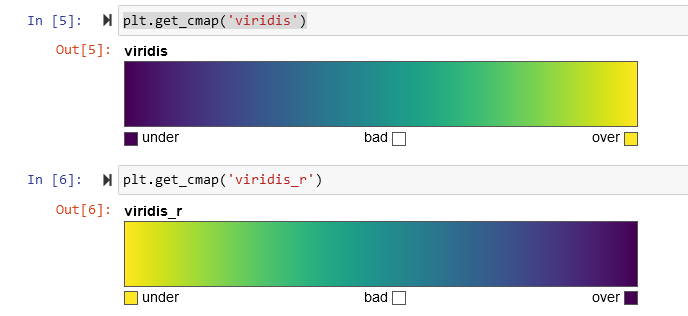
    The amazing @NPRougier (who has made many of the more explanatory images in our docs) has made this fantastic 3.1 cheatsheet! Find out how at github.com/rougier/matplo…
  • user avatar
    Matplotlib
    @matplotlib
    ৭ অক্টো, ২০১৭
    We are happy to announce Matplotlib 2.1.0! This is the culmination of 2 years of work by 275 contributors! matplotlib.org/users/whats_ne…
  • user avatar
    Matplotlib
    @matplotlib
    ১৯ সেপ, ২০২২
    ✋
    user avatar
    anna !!! :)) 🇵🇸🌸✨🌸🇵🇸
    @frogs4girls
    ১৬ সেপ, ২০২২
    i can’t breathe

X-এ নতুন?

আপনার নিজস্ব ব্যক্তিগতকৃত সময়রেখা পেতে এখনই নিবন্ধন করুন!

অ্যাকাউন্ট তৈরি করুন

সাইন আপ করার মাধ্যমে, আপনি পরিষেবার শর্তাবলী এবং গোপনীয়তা নীতি ও কুকিজ ব্যবহার সম্পর্কে মেনে চলতে সম্মত হচ্ছেন।

পরিষেবার শর্তাদি|Privacy Policy|Cookie Policy|অ্যাক্সেসযোগ্যতা|Ads info|© 2026 X Corp.
Don't miss what's happening
X-এ মানুষজন সবচেয়ে আগে জানতে পারে।
লগ ইনসাইন আপ করুন
Edit with